Preliminary Report on Plastic Pirates’ data
September 2022 – February 2023
Introduction
Two sampling campaigns are held each year. One in spring, the other is held autumn. The exact duration of each sampling campaign varies across participating countries depending on weather conditions and school vacations. In September 2022, with the start of the autumn campaign, a total of nine European countries were participating in the citizen science initiative with school children conducting samplings at European rivers and waterways until February 2023.

Quantitative Assessment
Note: Be aware that this report is being published while scientific analysis is still ongoing. All data results are preliminary and may be updated at a later stage.*
* This preliminary summary of the quantitative assessment provides a glimpse into the initial findings from Plastic Pirates' expansive initiative across nine European countries.
This preliminary summary of the quantitative assessment provides a glimpse into the initial findings from Plastic Pirates' expansive initiative across nine European countries.
Time period of samplings: September 2022 – January 2023
Countries: Austria, Belgium, Bulgaria, Germany, Greece, Hungary, Italy, Lithuania, Portugal, Slovenia, Spain
The data spans various indicators, offering insights into litter quantities, composition along riversides, kilograms of waste, and the identification of potential sources. While the results are in a preliminary stage and undergoing validation, they already highlight significant variations in plastic litter items, single-use plastics, and the weights of litter across participating countries. The assessment also offers a visual representation of reported sources of litter, emphasizing the diverse nature of this citizen science initiative's impact.

262 samples uploaded to the Plastic Pirates database
Number of Plastic Items
Riverbanks from nine European countries were screened for litter bigger than 2,5 cm. In the case of the sampling that took place in Bulgaria, the locations were coastal beaches instead. The preliminary data indicates that, on average, the highest number of plastic litter items per sampling event was observed by schools and students in Portugal, with approximately 164 plastic litter items per sampling, followed by Hungary and Slovenia (Fig. 1). Different school groups screened litter on average from 50 m to 200 m along riverbanks. The highest relative ratio of single-use plastics (SUPs) was observed in Hungary, Bulgaria and Spain (Fig. 1). SUPs were above 50% of the plastic litter items observations per sampling in Slovenia, Lithuania, Spain, Portugal, Greece, Bulgaria and Belgium (Fig. 1). Future analysis will include an overview of the sampling locations and proximity to industries, urban areas and volume of pluviosity during the sampling season.

Figure 1: Number of total plastic items per sample for each participating country. Single-use plastic items are shown as a proportion of the total number of plastic items observed. Please note that data refer to preliminary results.
Weight of the litter
The average weight of litter and plastic litter per sampling event for each participating country is shown in figure 2. According to these preliminary data, the total weight of all litter was observed to be highest in Hungary and Belgium (Fig. 2). For all countries, the relative weight of plastic litter was below 50% of the total litter weight observed in a sample.

Figure 2: Weight of the total amount of litter (in kilograms) per sample for each participating country. The weight of the plastic litter is shown as a proportion of the total litter weight. Please note that data refer to preliminary results.
Cigarette Butts – A waste item most commonly found
For each participating country, the number of cigarette butts found per sample along the riversides (beaches in the case of Bulgaria) can be seen in figure 3. These preliminary data indicate that, on average, the maximum number of cigarette butts observed per sample is 37, in Germany followed by Austria, and the minimum number is 1 (in Italy) (Fig. 3). For most countries, between ten and twenty cigarette butts per sampling event were found.

Figure 3: Number of cigarette butts found per sample for each participating country. Please note that data refer to preliminary results.
Potential sources of litter
A visual representation of the reported (potential) sources of litter indicated in the Plastic Pirates datasets is shown in figure 4. Sources that were most frequently mentioned amongst the participating countries are visitors and residents, followed by agriculture and fly-tippers.

Figure 4: Report of potential sources of litter based on visual inspections by the local observers. The prevalence of the sources mentioned in all datasets (in total) is represented by the size of the words, with larger fonts representing the sources that were mentioned with a higher frequency among the participating countries.
Microplastic Samples
170 microplastic samples
Overall, in the first EU campaign of Plastic Pirates, 170 microplastic samples were collected from 203 riverside samplings conducted in 9 countries (Lithuania and Germany are excluded as they did not provide microplastic data yet). These samples were subsequently sent to scientific institutes for analysis. They underwent Fourier Transform Infrared Spectroscopy (FTIR) to determine particle material. In total, 867 FTIR analyses were conducted, which encompassed both positive values (plastic polymers identified) and negative values (other types of organic and inorganic material). However, the number of positive versus negative FTIR analyses varied among countries and was contingent on the expertise of the researchers involved. Generally, researchers more experienced with plastic and riverine samples tended to conduct fewer FTIR analyses as they could more effectively pre-sort particles from the sample.
Within each FTIR analysis reported, the particles were analysed 1 to 3 times (from different surfaces), and multiple scans were conducted to gather data about the sample. The number of scans per individual FTIR analysis can vary based on factors such as the instrument settings, the nature of the sample, and the time the researcher allocates for analysis. For example, in Slovenia, if the output score results are higher than 85%, the number of scans was set at a minimum of 4 scans, while for particles that do not show a clear pattern, the number of scans set is increased to 16 or 32. Spain used 16 scans, and Italy and Austria used 32 scans for each analysis.

Conclusion
The Plastic Pirates – Go Europe! initiative is a successful citizen science project, engaging young participants aged 10-16 across Europe in the collection of valuable data on plastic waste pollution. With a focus on contributing to scientific excellence and aligning with EU policy objectives, the initiative involves four distinct groups undertaking samplings to comprehensively study litter quantities, categorization, investigations into larger items and microplastics, and meticulous documentation. Supported by the Coordination and Support Action “PlasticPiratesEU,” the initiative has upscaled its efforts, implementing pilot projects across Europe under the Mission Restore our Oceans and Waters by 2030, with funding from the European Union’s Horizon Europe program.
This report offers a transparent overview of the structured data processing and verification procedures employed by the Plastic Pirates initiative. The meticulous steps, including sampling attempts, metadata verification, and detailed assessments of riverside and floating litter data, ensure the accuracy, reliability, and integrity of the citizen science data. Additionally, the preliminary quantitative assessment provides a glimpse into the initiative's impact, showcasing variations in plastic litter items, single-use plastics, and litter weights across participating countries. Visual representations and cautionary notes about the ongoing scientific analysis underscore the initiative's commitment to delivering high-quality, reliable, and impactful results in the ongoing fight against plastic pollution.
Plastic Pirate Results - A Summary of the years 2016 to 2020
Since the start of the Plastic Pirates in 2016, more than 15.000 children and young people have collected data on riverine pollution at more than 900 locations in all 16 German federal states. The majority of the data come from the Rhine and its tributaries, followed by the Danube, Elbe and Weser. However, smaller watercourses such as the Ems, Peene or Oder were also investigated by the plastic pirates.
Parallel to the ongoing field samplings by participating schools, the team at the Kiel Science Factory is continuously validating data from previous sampling periods. The data and corresponding analyses are published in peer-reviewed scientific journals. This is very important to make the results accessible to the international research community. So far data and analyses on litter from the riverside of the years 2016 and 2017 (litter composition, litter accumulation and litter sources) is published in the journal “Environmental Pollution” (https://doi.org/10.1016/j.envpol.2018.11.025).
Not all of the data presented here have yet been conclusively verified and therefore serve as an preliminary overview.
Litter quantities and composition of litter on the riverside (Group A, formerly Group 2)
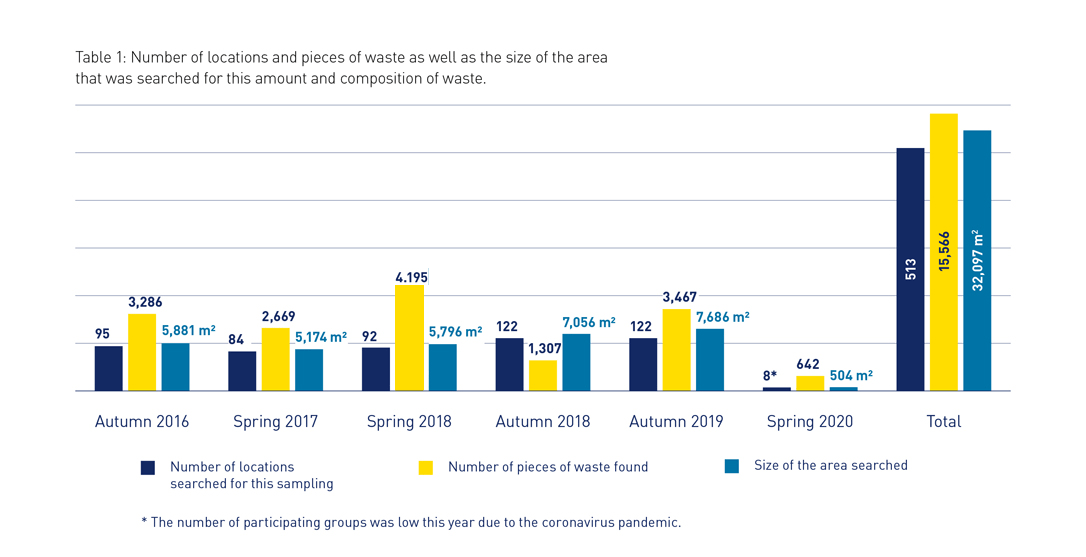
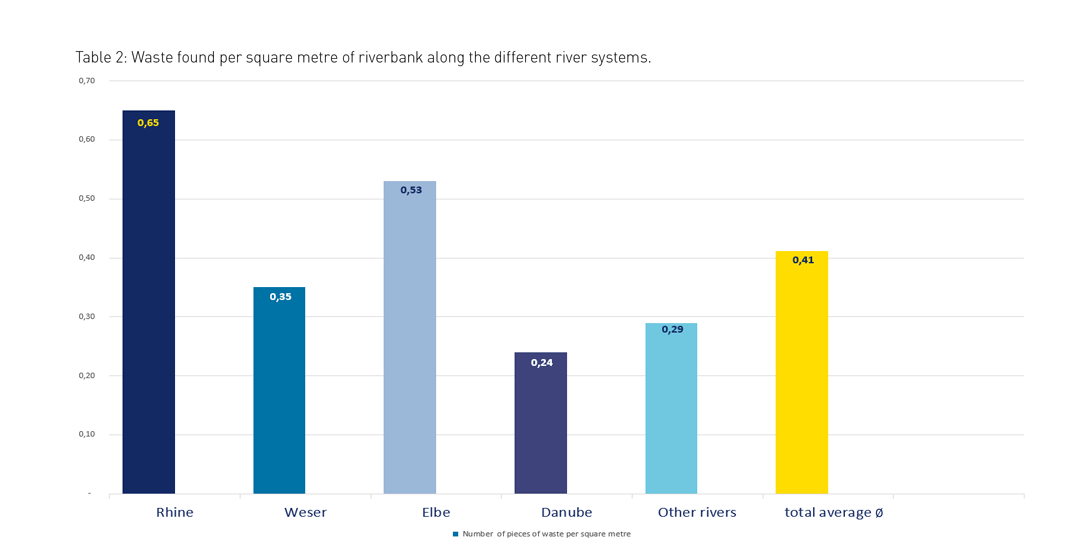
To evaluate the litter on the riverside, 513 sites were sampled by the participants. In total, the Plastic Pirates identified 15,566 pieces of litter covering 32,097 square metres of riverside. This means an average of 0.48 pieces of litter per square metre. In other words, a classroom with a size of 50 square metres would comprise 24 pieces of litter. However, there were differences between the river systems: The total amount of litter was found to be higher at the Elbe and Rhine and comparatively fewer items were found at the Danube and Weser.
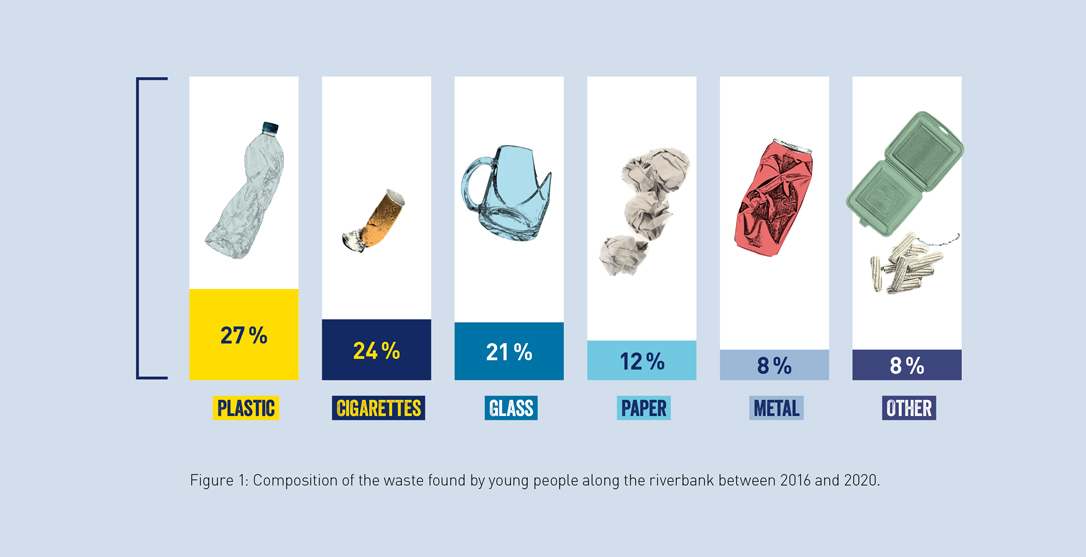
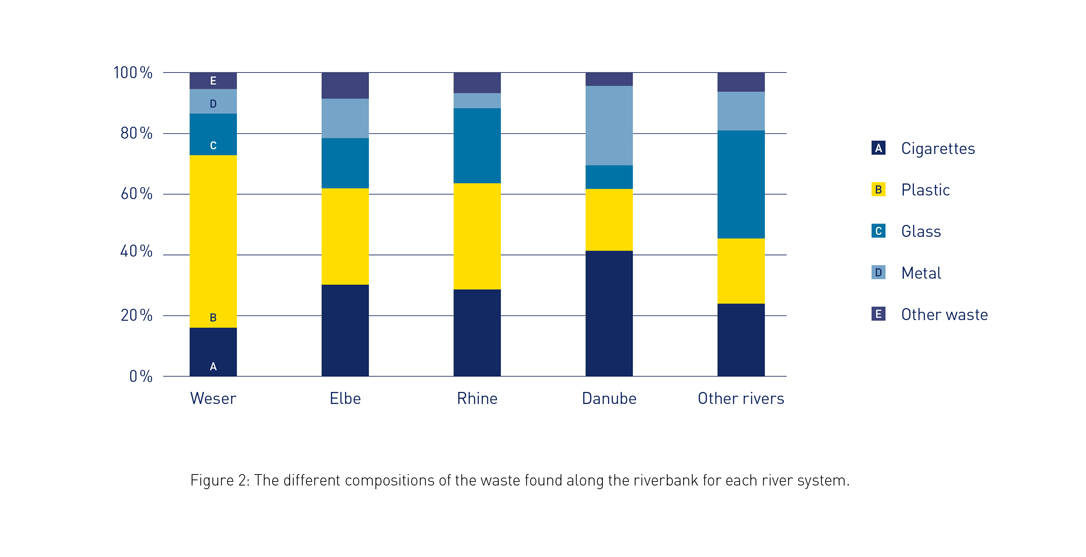
Most of the litter found by the children and young people was plastic (27%), followed by cigarette butts (24%), glass (21%), pieces of paper (12%) and metal (8%). Other items, such as food scraps, made up 8% of the litter found (see Figure 1). The type of litter found varied between the examined river systems. While in the Weser plastic was the dominant litter type, the rivers Elbe, Rhine and Danube are equally dominated by cigarette butts and plastic. Furthermore, a considerable contribution to the total litter in the river Rhine came from glass (see Figure 2).
Litter accumulation and findings of hazardous material on the river bank (formerly group 3)
Studies on riverside litter accumulations were explored in the years 2016 to 2018. Overall, litter accumulations were found by 60 % of the 255 participating groups. These litter accumulations consisted mainly of packaging material, cigarette butts and newspapers. A total of 1.961 litter accumulations were identified.
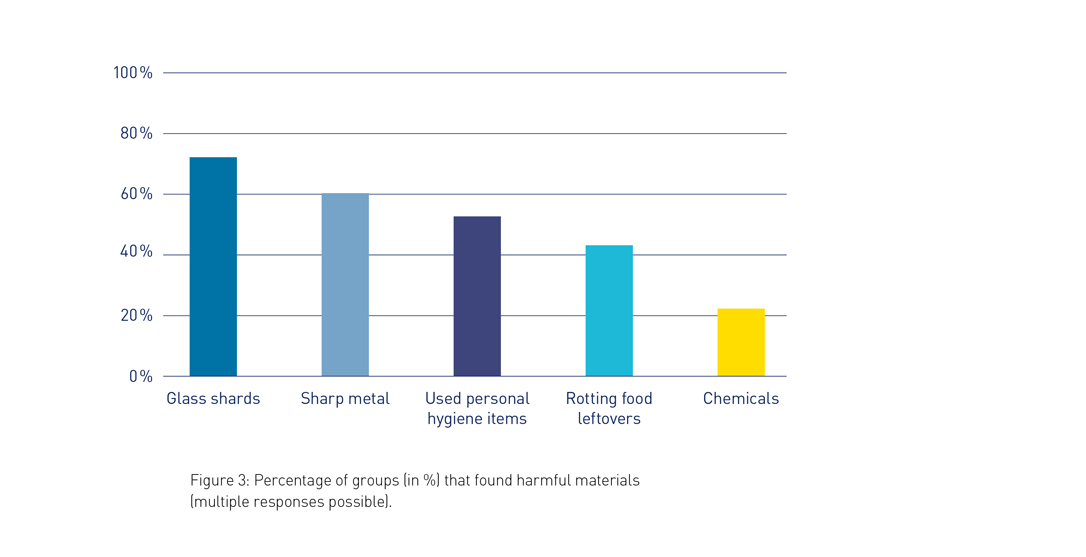
The participants also looked for potentially dangerous materials such as broken glass, sharp metal objects, used hygiene articles or chemicals. In total, data from 479 groups were analysed. 89% of the groups found dangerous material during their exploration. Glass fragments were found most frequently (at more than 71% of the sites), followed by sharp metal objects and used hygiene articles. Rotten food scraps (43%) and chemicals (23%) were found less common (see Figure 3).
Disposables on the riverside (Group B)
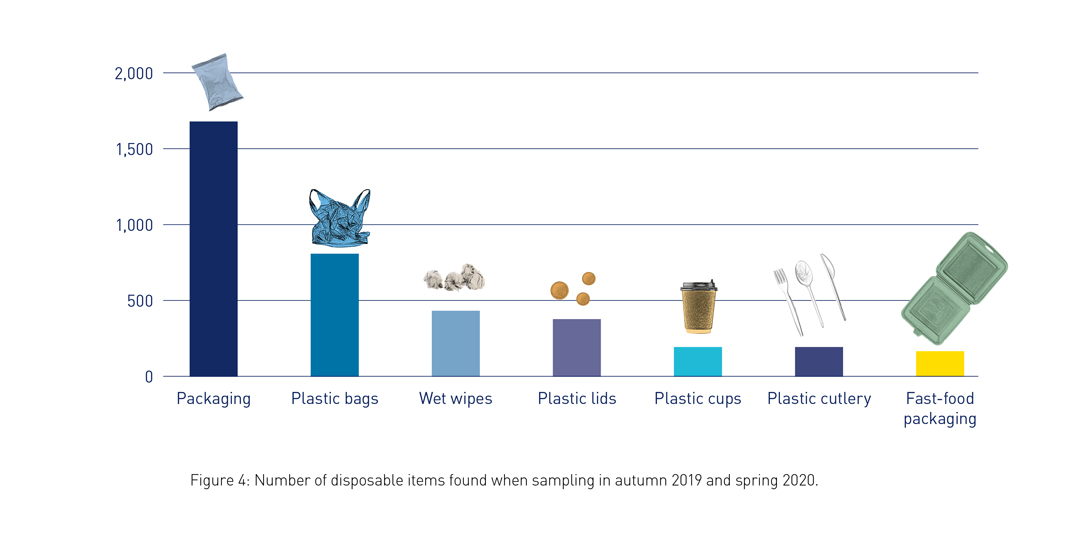
From summer 2021, a ban on certain single-use plastic articles will be introduced within the EU. In order to obtain information on whether and how much single-use plastic is actually located at the riverside, the Plastic Pirates investigated these litter objects in 2019 and 2020. In total, the participants surveyed 130 sites for litter diversity along the riverside and collected and identified 26,974 pieces of litter along the riverside. Of these, 16% consisted of single-use plastics, such as packaging material from sweets, as well as plastic bags. Wet wipes and plastic coffee lids were also found by the plastic pirates. Plastic bottles, cups and single-used cutlery made up about 5% of the total disposable waste found at the river. Cigarette butts (33% of the total litter found) and broken glass (21%) were found more frequently. Paper (13%) and bottle caps (9%) were also among the many items found.
Floating litter in the river (Group C, formerly Group 4)
In this group, data from 520 sites were analysed to identify larger pieces of litter floating on the river surface. As a result, a total of 1,354 pieces were identified by the children and young people. On average about 3 pieces of litter drifted by per hour. However, the data recorded here can only be regarded as a minimum: Particularly large and wide rivers could not be completely surveyed by the school and youth groups. Furthermore, litter that accumulated on tree branches or at dams is not considered here and was therefore often difficult to identify. Considering the identifiable objects, most of the floating litter consisted of plastic.
Large microplastics in the river (> 1mm) (Group C, formerly Group 4)
To determine the amount of large microplastics in the river, the sampling was carried out by 494 groups. After an initial analysis by the school classes and youth groups, 32% of the groups reported large microplastics in their samples. When reviewing the samples from 2016 and 2017 with an FTIR spectrometer for validation, it was revealed that larger microplastic items were detected in 48% of the samples. However, it should be noted that only microplastic particles larger than 1 mm were caught within the sampling net, but many of the microplastic particles released into the environment are much smaller than that. Furthermore, there are types of plastic that settle at the bottom of the river due to their specific density properties and thus cannot be captured by the sampling net. Nevertheless, there were groups whose samples contained up to 150 microplastic particles. Such high quantities were, for example, found in the Rur (or Eifel-Rur), a 164 km long tributary of the Meuse, and also in Schkopau, where over 200 plastic particles were found.
Potential sources of litter along the riverside (Group D, formerly Group 5)
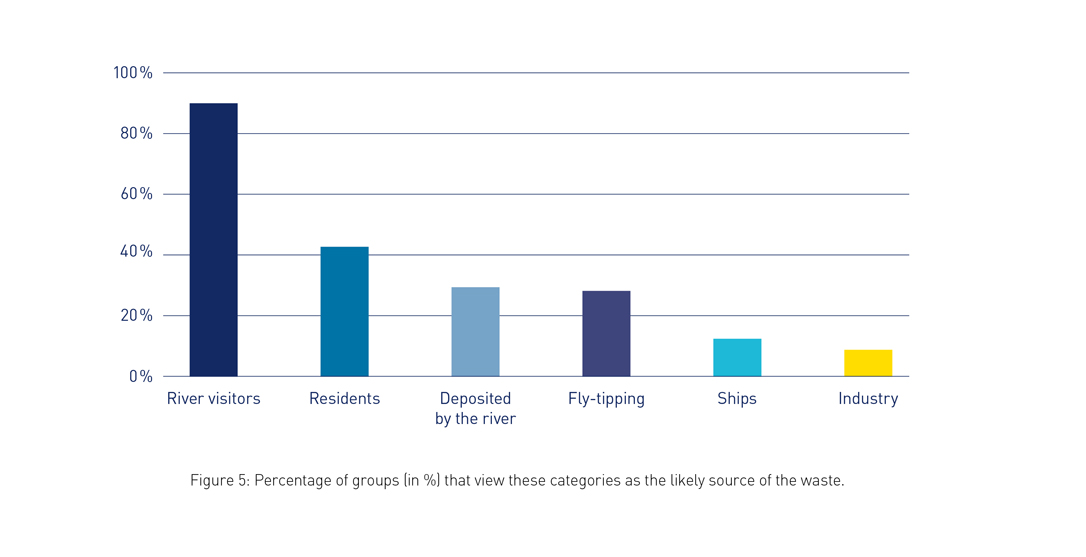
According to the participants, most litter was caused by recreational visitors as the most likely source at 88% of the 490 sites. This was evident from the large number of food wrappers, cigarette butts and leftovers from picnics and barbecues (e.g. plastic cutlery, plastic bags, barbecues and charcoal left behind). Local residents were identified as the most likely source at 41% of sites, followed by accumulation due to river flow (30%), illegally dumped litter (28%) and litter generated by boat and ship traffic (13%). Industrial sources were identified as a potential source of litter by 9% of the groups (see Figure 5). As this assessment is often subjective, photos were taken by the children and young people so that the source of pollution could subsequently be verified.
Conclusion and outlook
The research of the plastic pirates shows that more than 50% of the litter found on the river banks consists of plastic and cigarette butts and thus, due to the long decomposition time as well as the toxic effect, also endangers the ocean. The fact that the litter found is not only an environmental problem, but also potentially dangerous for humans, is shown by the findings of hazardous materials discovered on almost every riverside. However, some groups did not find any litter at all and have sometimes expressed their disappointment about this. But this is of course the best result!
Furthermore, river visitors have been identified as the main source of larger litter items. Therefore, it is important to encourage a change in consumer behaviour: buying less plastic also means that less plastic ends up in the environment. A first step in this direction is the new EU directive prohibiting certain single-use plastic items, some of which were also found on German riverside (e.g. single-use plastic cutlery, which will be banned from production and sale in the EU from July 2021).
Overall, the number of participants was impressive: since the start of the project in 2016, more than 15,000 young people have taken part in the project. They have completed the long journey from learning about the Plastic Pirates method to data collection and evaluation, and finally submitting the data sets and samples. We are very proud of this achievement. Without the help of the young researchers, this project would not have been conducted. Under normal scientific conditions, it would have taken years to collect data with this enormous spatial distribution. The children and young people have made an important contribution to researching the pollution of German rivers and thus, a valuable input to the protection of rivers and oceans worldwide.